- 415-386-7111
- info@worldcapitalmanagement.org
- Mon - Fri: 7.00 - 5.00 (PST)
WCM's Investment Strategy
Our Investment Strategy & Back Tested History
World Capital Management (WCM) believes that understanding stock market cycles is crucial for investors because it enables investments to be effectively managed for return and risk. By recognizing the different stages of the market cycles, WCM makes informed decisions about when to buy or sell stocks, adjust portfolios accordingly, and capitalize on market trends.
During economic expansion, the stock market tends to perform well due to rising consumer spending, increased job creation and production, and higher company profits. However, economic expansions can experience boom and
bust cycles, with stock market performance influenced by factors such as inflation and interest rates.
Understanding these cycles is crucial for investors to manage risk and capitalize on market trends.
World Capital Management invests using highly diversified indexes, high liquidity, high leverage, and a multi-decade tested mathematical cyclical model to achieve several objectives, including maximizing returns, managing risk, and maintaining flexibility in their investment strategy.*
Here’s a breakdown of each factor:
Mathematical model: By using a mathematical model to analyze data and make investment decisions, World Capital Management can make objective and data-driven choices. This removes emotions from the investment process and reduces the risk of cognitive biases. Additionally, a mathematical model can help identify opportunities that may not be immediately apparent to human analysts, particularly in complex and rapidly changing markets.
Management can make objective and data-driven choices. This removes emotions from the investment process and reduces the risk of cognitive biases. Additionally, a mathematical model can help identify opportunities that may not be immediately apparent to human analysts, particularly in complex and rapidly changing markets.
Taken together, these factors can help WCM achieve our investment objectives, while also managing risk and maintaining flexibility in our investment strategy.
Highly diversified index: By investing in a diversified index, WCM can reduce asset exposure to individual company risk and capture the performance of a broad market or sector. This strategy can help mitigate the impact of sudden market movements, unexpected news, or changes in regulations that can have a significant impact on a single company or industry.
High liquidity: By investing in assets with high liquidity, WCM can buy or sell their positions with limited price impact. This can be particularly important when markets are volatile or uncertain, as it allows for more flexibility in their investment decisions.
High leverage: Using leverage allows WCM to amplify the returns of their investments. This can be particularly beneficial when market conditions are favorable, and there is a high likelihood of positive returns. However, leverage also increases the risk of losses if the market goes against them, so we use this strategy.
judiciously.
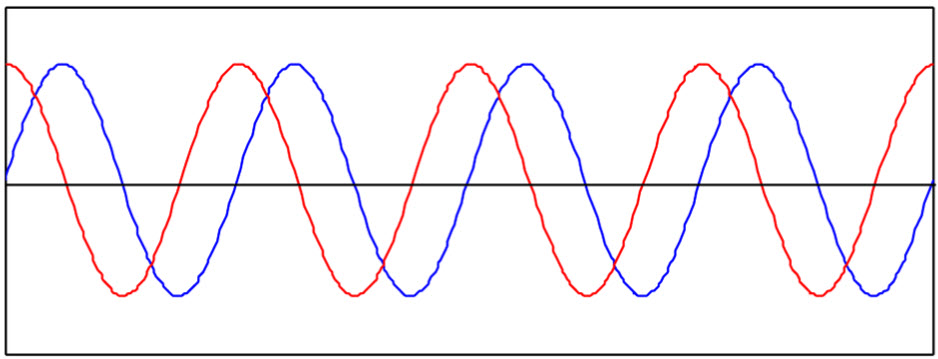
Cyclical Technical Analysis (CTA)
World Capital Management’s Cyclical Technical Analysis (CTA) indicator consists of the following components:
Average True Range (ATR):
ATR is a volatility indicator that measures the average range of price movement in each period. It is used to calculate the distance of the CTA bands from the moving average.
Moving Average (MA):
The MA is a trend-following indicator that calculates the average price of an asset over a specified period. It is used as the baseline for the CTA calculation.
STA Bands: The STA bands are calculated by adding or subtracting a multiple of the ATR from the moving average. The resulting upper and lower bands form the CTA indicator.
Trend Direction: The direction of the trend is determined by the position of the price relative to the STA bands. When the price is above the upper band, the trend is bullish, and when the price is below the lower band, the trend is bearish.
Signal Line: A signal line is used with CTA indicators to provide additional confirmation of trend direction. The signal line is typically a moving average of the CTA indicator itself. These components work together to provide an overall trend in the market, as well as potential entry and exit points for trades.
*Past performance does not guarantee future returns. The performance shown is based on proforma calculations using identical mathematical formulas for all ETFs. All ETFs reflect 3x of the leverage of the underlying index. Returns ETFs. All ETFs reflect 3x of the leverage of the underlying index. Returns do not include earned interest when portfolio proceeds are held in cash. Portfolio returns are not adjusted forproceeds are held in cash. Portfolio returns are not adjusted for commissions or management fees. All data used in this presentation is believed to be accurate but is not guaranteed. in this presentation is believed to be accurate but is not guaranteed.
©World Capital Management, 2023. Telephone 1-415-386-7111 Email: info@WorldCapitalManagement.Org
World Capital Management's cycle & trend analysis
reduces risk and optimizes performance.
Our investment model successfully anticipated
the bull 2020 and bear 2022 markets.

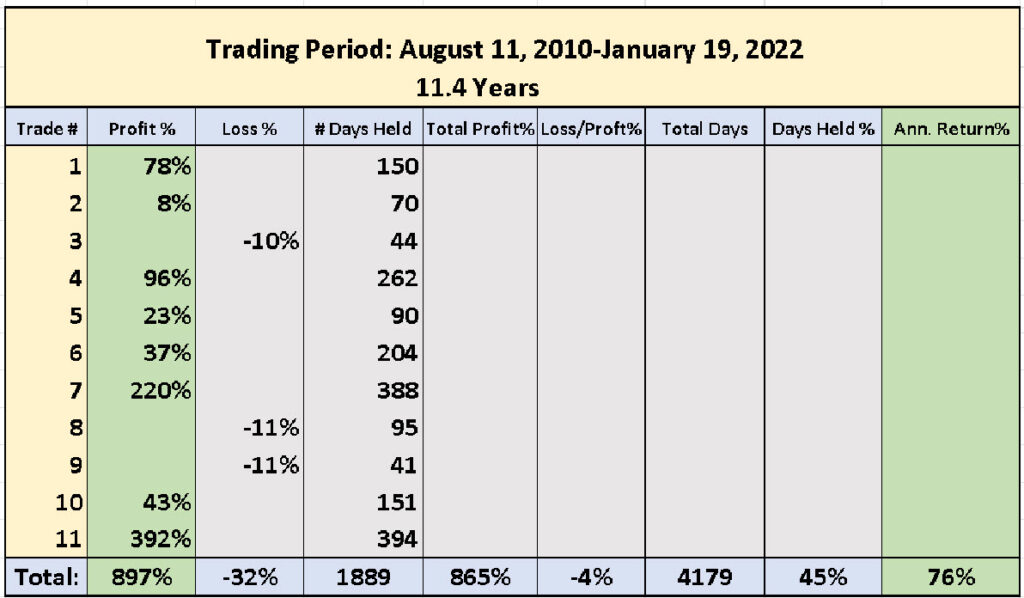
TQQQ (3x Nasdaq-100 Index shares) Trading Performance for 11.4 Years
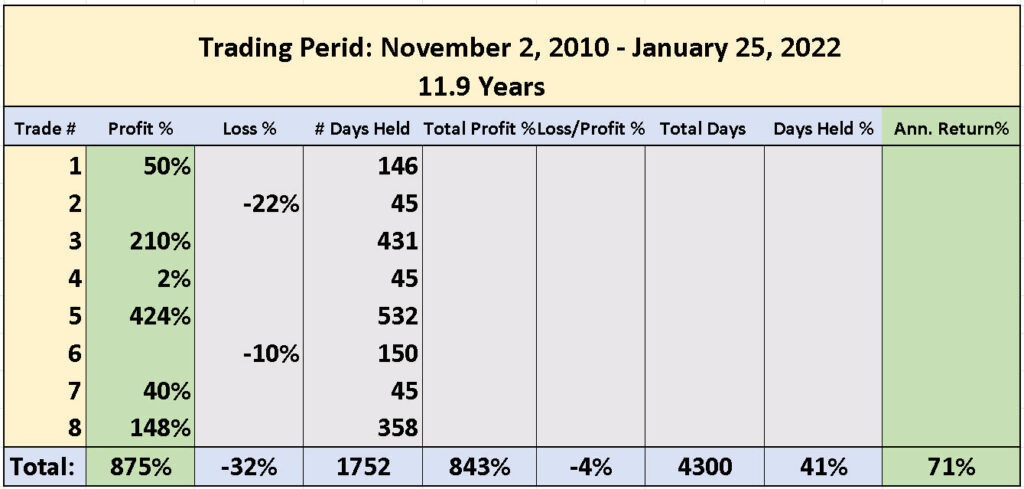
SOXL (3x Semiconductor Index shares) Trading Performance for 11.9 Years
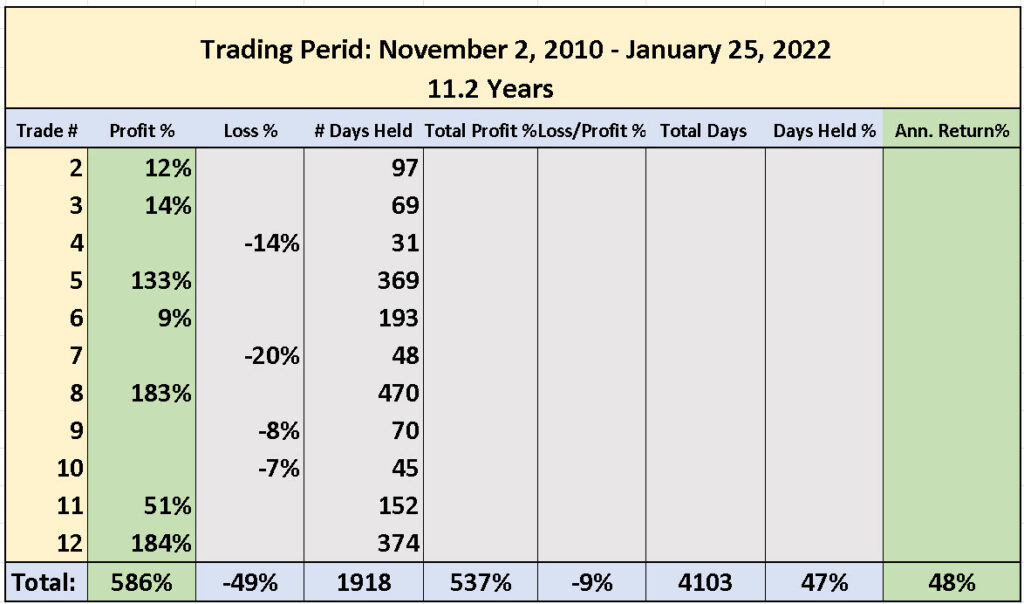
TECL (3x technology Index shares) Trading Performance for 11.2 Years
SPXL (3x S&P 500 Index shares) Trading Performance for 11.25 Years
